


UPDATE 24th November: After experimenting with the updated Insights app in Microsoft Teams I have some additional observations:
- The Insights App updates student activity fast – like, really fast. I worked as a student in my demo tenant and then check the Insights app as the teacher of the Team and could see the activities within 1-2minutes of them being done:

- This got me me thinking that the Insights app could go someway towards answering that question many teachers ask when it comes to device usage in classrooms:
How do I know if my students are working on the tasks I want them working on, when all I can see is the back of their laptop screens?
- Whilst I would always promote active teacher engagement with students by wandering around the room and doing visual and oral check in with students as part of good classroom practice, the Insights app would allow a teacher to see if the student has opened the required files and edited them in close to real time, during an actual lesson.
- This could be especially helpful if teaching a hybrid class with students not physically present in the class
- With sufficient planning and scaffolding, the various activities captured by Digital Activities reporting in the Insights app could allow a teacher to structure a clear learning pathway inside of Teams, similar to what a traditional LMS might afford e.g.
- Start at a certain channel and make a post in the Conversations tab e.g. what your inquiry question is going to be (logged by Channel View in Insights)
- Find one other question posted by a classmate and leave a reaction to it (logged by Reactions in Insights)
- Navigate to the Files tab in the channel and open the template exemplar (Files opened logged by Insights)
- Create your own file and complete your inquiry (edited files logged by Insights)
- If the Insights App was showing that students were not ‘on task’ by their lack of activities, the teacher can easily spark a conversation with them to see if they need assistance with the work, or a reminder to stay focused to meet the completion time frames of the assigned task.
Looking for resources and training to get started?
- Get the Insights 1-pager and complete guide PDFs
- Watch a step-by-step tutorial on how to use Insights
- Train yourself with the free Insights course on the Microsoft Educator Center
- Check the Insights support page for more how-tos and help
- Find out more about the IT side with the Insights IT support page
Background to my love for data
I have been interested in educational analytics for years now, and many of my early forays into collecting student data were using freely available and often Open Source solutions. It was in my previous role as Director of ICT at St Andrew’s College that I caught the love of blogging and you may be interested to read some of my posts around data collection and analysis with a view from insight a school. Some notable call outs:
- Digitizing, anonymizing and securing the voting of student leaders. This was a solution I was thrilled about as it had a real and immediate impact on the College.
- Another favourite, this time using the Open source Learning Management System Moodle and some custom scripts to visualize student attendance and grades on each course, both for teachers and students.

- We soon started exploring how we could use some of the Microsoft tools for data collection, processing and visualization which started with tools like MS Query, Excel and eventually led to PowerBI
- Pastoral Care seemed an obvious place to get started with increased data visualization and we pulled data from a range of different sources and built dashboards in PowerBI that leveraged Row Level Security, meaning teachers could only see the data on the students in their classes.
- A last one to perhaps check out is how we started reporting on student academic progress – some videos here showing the dashboards as they looked in 2016:
One other area I wanted to use reporting was across the Moodle LMS to see what touch points and telemetry we could gather to get insights into student engagement. One of the real strengths of Moodle and its open source foundation, is that anyone in the community can build plugins and modules that other users can implement and tweak. I picked up the Engagement Analytics plugin and deployed this for insights. This provided some interesting insights through reports similar to the below:

Engagement, according to this plugin, was defined as:
The Engagement Analytics block provides information about student progress against a range of indicators. As the name suggests the block provides feedback on the level of “engagement” of a student, in this plugin “engagement” refers to activities which have been identified by current research to have an impact on student success in an online course. The plugin was developed as part of a NetSpot Innovation Fund project by Monash University (Project manager: Dr Phillip Dawson), with code by NetSpot developers (Ashley Holman and Adam Olley).
From the project plan: “We intend to implement a block that teachers can add to their Moodle course that will provide them with a quick graphical snapshot of which students are at risk.” (Dr Phillip Dawson)
Currently the plugin has three indicators: – Forum activity – Login activity – Assessment activity
Engagement Analytics Plugin – MoodleDocs
This immediately turned up some interesting insights with teachers able to observe the “lurker” phenomenon: students that regularly logged in, would go to (and presumably read) class forums, but rarely, if ever, post. This would become very obvious from a quick scan of the engagement analytics and aid the teacher in prompting those students with a “next step” activity to move from reading to contributing.
Another insight this revealed was that many students who rarely contributed to class discussion, were over very active and ‘vocal’ on forums – a place where they could think through their answer first in detail, and then draft and post an asynchronous response. It highlighted that whilst some students felt uncomfortable or perhaps less confident in ‘real time’ back and forth discussion typical in many classrooms, they were more than capable of contributing excellent answers in a classroom forum activity.
Updates to Microsoft Teams Insights App
Insights were added to Microsoft Teams for Education over a year ago and during the COVID19 Pandemic, provided a valuable touchpoint for teachers on what and how students were engaging with during distance learning. If you’re new to Insights then this support article is critical as a starting point as it shows how to add the app to your Teams and get started.
It was really great to see that last week the Insights team released a blog post showing that there are 6 new ways you can track student engagement in your classes. As always, I encourage you to read the original blog post in full here, but if you’re in a rush, see below for the six new features:
- See engagement across multiple classes
- Drill down to specific activity within a class
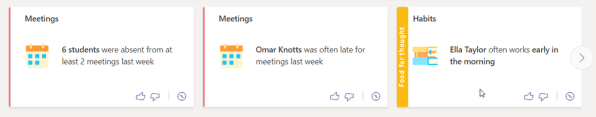
- Get spotlights of student behavior and individual habits
- See overall student activity (or inactivity) on Teams
- Drill down to see synchronous class behavior (aka Teams meeting behavior)
- Get quick access to class grades and grade distributions
The big shift here with Insights is the ability to get greater information around outliers e.g. immediate identification of students that have been absent from online class meetings, and even “habits” – i.e. alerting you to which students have been working on assignments very late at night, or very early in the morning.
Of the above features, it’s the first four that appeal to me the most:


My Thoughts
Insights are only as useful as the actions they generate.
I remember teaching a student History and Moodle Engagement Analytics revealed that he was mostly doing his homework submissions and forum posts after 1am. This insight prompted me to have a conversation with him which led to me learning he was working the late shift at Kentucky Fried Chicken to help pay the rent on the family home. This sparked a great discussion on how we could modify homework expectations for him so he could continue to support his family financially whilst still progressing his academic study.
When I look at these new Insights from the team I’m excited because it’s the perfect tool to assist teachers who we all know are time-poor. Leveraging high level dashboard overviews across all classes provides the starting point for a teacher with insights. In my experience, when a teacher starts getting useful data insights they become what I call “data curious” and love to dig deeper and ask more questions of the data. This can lead educational institutes down the pathway of creating bespoke data warehouse platforms for reporting, but with these new Insights with Teams, this will fill that need for many teachers with no customization required.
Here is a video from Mike Tholfsen showing how the original Insights App can be installed and works:


No Responses